Java has automatic memory management. It performs routine garbage collection to clean up unused objects and free up the memory. However, it is very important for us to know how the garbage collector works in order to manage the application’s memory effectively. Thus avoiding OutOfMemoryError and/or StackOverflowError exceptions.
Let’s start with the memory structure first. For effective memory management, JVM divides memory into Stack and Heap.
Stack Memory
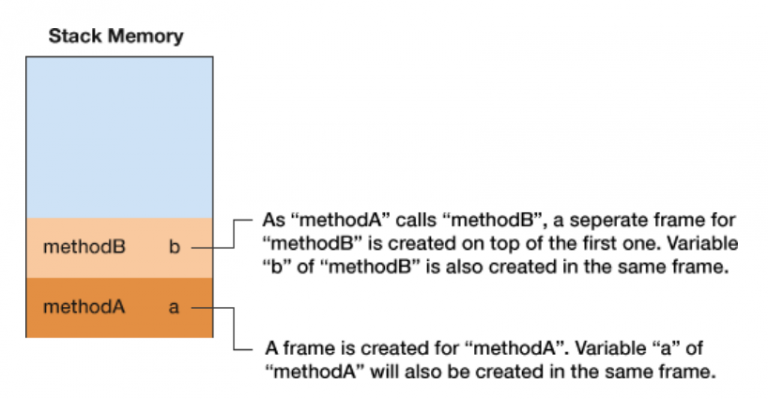
Java Stack memory is used for the execution of the thread. They contain method-specific values which that are short-lived and references to the other objects in the heap that are getting referred from the method.
Example:
public void methodA() {
      int a = 10;
      methodB(a);
}
public void methodB(int value) {
      int b = 10;
      //Rest of the code.
}

Stack Memory
From the above picture, it is clear that local variables of the respective method will be created in the same frame. For example, variable “b” of “methodB” can be accessed by “methodB” only and not by “methodA”, as “methodA” is in separate frame. Once the “methodB” execution is completed, the control will go to the calling function. In this case, it’s “methodA”. Thus, the frame for “methodB” will be removed from the stack and all the variables in that frame will also be flushed out. Likewise, for “methodA”.
Heap Memory
Java heap space is used to allocate memory to the objects. Whenever we create Java/Kotlin objects, these will be allocated in the Heap memory.
Garbage collection process runs in the heap memory. Let’s go through the basic garbage collection process and structure of the heap memory in detail
Garbage Collection Process
Garbage Collection is a process of cleaning up the heap memory. Garbage collector identifies the unreferenced objects and removes them to free the memory space.
The objects that are being referenced are called ‘Live objects’ and those which are not referenced are called ‘Dead objects’.
This process can be triggered at any time and we don’t have any control over it. We can also request the system to initiate GC process in case we want to. But there is no guarantee that it will be initiated by the system, it is up to the system to decide.
Let’s go through the basic process involved in Garbage collection.
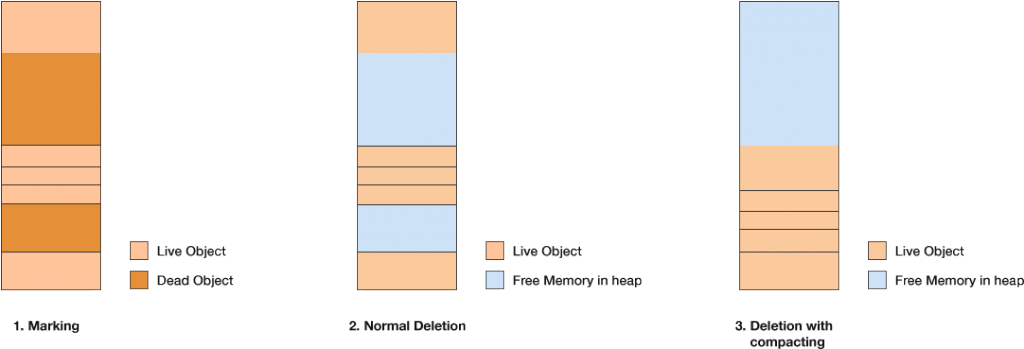
Step 1 : Marking
Most of us think that Garbage Collector marks dead objects and removes them. In reality, it is exactly the opposite. Garbage Collector first finds the ‘Live objects’ and marks them. This means the rest of the objects that are not marked are ‘Dead objects’.
Step 2 : Normal Deletion
Once Garbage Collector finds the ‘Dead objects’, it will remove them from the memory.
Step 3 : Deletion with Compacting
Memory allocator holds the reference of the free memory space and searches for the same whenever new memory has to be allocated. In order to improve performance, it is better if we move all the referenced objects to one place. Thus, this step helps in improving the memory allocation process.

Basic GC process
This algorithm is called a mark-sweep-compact algorithm.
As the number of objects increase, the above process i.e., Marking, Deletion and Deletion with compacting is inefficient. As per the empirical analysis, most objects are short-lived. Based on this analysis, the heap structure is divided into three generations.
Heap Structure
The heap structure is divided into three divisions namely, Young Generation, Tenured or Old Generation, and Permanent Generation.

Heap Structure
Young Generation – This is where all the new objects are allocated and aged. This generation is split into Eden Space and two Survivor spaces.
Eden Space – All new objects are allocated here. Once this space is full, minor Garbage Collection will be triggered. As mentioned, when the Garbage Collection is triggered, it first marks all the live objects in Eden Space and moves them to one of the Survivor spaces. Thus, Eden space is cleared so that the new objects can be allocated there again.
Survivor Space – After Minor GC, the live objects from Eden space will be moved to one of the survivor spaces S0 or S1.
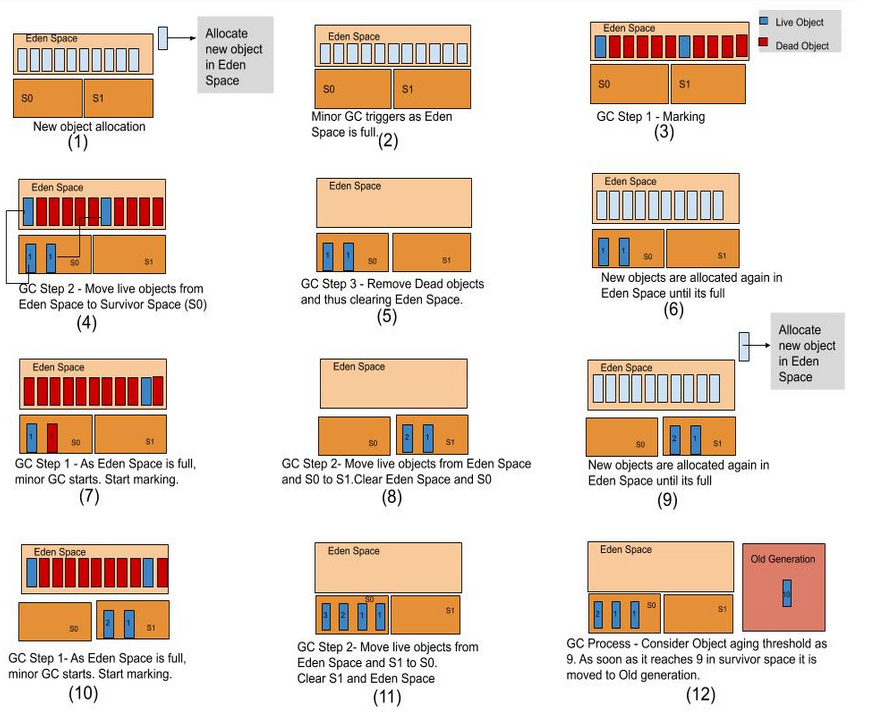
The below diagram describes the Garbage Collection process in Young Generation.

GC process in Young Generation
Let’s see how the object is allocated and either flushed (Garbage Collection Process) or moved to an older generation in detail. Each point below explains the respective state number mentioned in the above diagram:
- Initially, all objects are allocated in Eden Space.
- Once Eden Space is full, Minor GC will be triggered. Minor GC is always “Stop the World Event”. This means that when this process is executed, the application thread will be stopped.
- The first step in GC Process as mentioned is Marking. Garbage Collector identifies live objects and marks them. As shown in the above picture, two of the objects are referenced while others are unreferenced objects.
- Once marking is done, live objects in Eden Space are copied to one of the Survivor spaces and the rest of the objects are removed. Thus, clearing Eden Space. This algorithm is called a mark-copy algorithm. In order to understand the aging of the objects, let’s consider the age of the object in S0 as 1.
This shows the state of Young Generation after Step (4)
- Now, if new objects are to be created then these will be allocated in Eden Space.
- Once again Eden Space is full, which in turn triggers Minor GC. Here, objects in the Eden Space and Survivor space S0 are scanned. Garbage collector marks all the live objects in Eden Space and S0. As shown in the diagram, at this stage Eden space and S0 have one live object.
- In Step (7), the marking process is completed. Thus GC will move all the objects from Eden Space and S0 to S1. This clears both Eden Space and S0. Let’s calculate the age of the object. The age of the object moved from S0 to S1 will be incremented by 1. Thus, its age will be 2. The age of the object which is moved from Eden Space to S1 will be 1.
- Now, if new objects are to be created, they will be allocated in Eden Space of the young generation.
- Once again Eden Space is full, which in turn triggers Minor GC. Here, objects in the Eden Space and Survivor space S1 are scanned. Garbage collector marks all the live objects in Eden Space and S1. As shown in the diagram, at this stage Eden space and S1 have two live objects.
- All the live objects from Eden space and S1 will be moved to S0. The age of the objects moving from S1 to S0 will thus be 3 and 2 respectively as shown in the diagram. This means that in this process, age will be incremented by 1. The objects moving from Eden Space to S0 will be 1.
- This stage shows the object moving from the young generation to the old generation. Let’s set the threshold for the age of the object to move to the old generation to 9. Consider the scenario where the age of the object is 9 in the young generation. As the age of the object has met the threshold, this object will be moved to the Old Generation.
Note: Observe that, at any given time only one survivor space has objects. Also, note that the age of the object keeps increasing when switching between the survivor spaces.
Old Generation – Here, long-surviving objects will be stored. As mentioned, a threshold will be set to the object, on meeting which it is moved from the young generation to old or tenured generation. Eventually the old generation needs to be collected. This event is called a major garbage collection.
Major garbage collection are also Stop the World events. Often a major collection is much slower because it involves all live objects. So for responsive applications, major garbage collections should be minimized. Also note, that the length of the Stop the World event for a major garbage collection is affected by the kind of garbage collector that is used for the old generation space.
Note: Responsiveness means how fast an application can respond. The applications that focus on responsiveness, should not have large pause times. This in-turn means, memory management should be done effectively.
Permanent generation – This contains metadata required by the JVM to describe the classes and methods used in the application. The permanent generation is populated by the JVM at runtime based on the classes in use by the application. In addition, Java SE library classes and methods may be stored here.
Types of Garbage Collectors
- Serial GC
- Parallel GC
- Concurrent Mark and Sweep (CMS) collector
- G1 Collector
These garbage collectors have their own advantages and disadvantages. As Android Runtime (ART) uses the concept of CMS collector, we will only discuss Concurrent Mark and Sweep (CMS) Collector here.
GC Algorithms
An important aspect to remember is that, usually two different GC algorithms are needed – one for the Young generation and the other for the Old generation.
We have seen the core concepts of GC process. Let’s move to the specific GC type which is used as default by Android Runtime.
The default GC type used by ART is CMS Collector. Let’s look into it further in detail.
Concurrent Mark & Sweep (CMS) Collector
This collector is used to avoid long pauses during the Garbage collection process. It scans heap memory using multiple threads. It uses parallel Stop the World mark-copy algorithm in the young generation and concurrent mark-sweep algorithm in the Old Generation.
As discussed, Minor GC occurs in young generation whenever Eden Space is full. And this is “Stop the World event”.
GC process in Old generation is called Major GC. This garbage collector attempts to minimize the pause duration that occurs during the GC process by doing most of the Garbage Collection work concurrently with the application threads.
We can split the Major GC into the following phases:
Phase 1 – Initial marking
This is one of the “Stop the World” events in CMS. In this phase, the objects that are either direct GC roots or are referenced from some live objects in the Young Generation are all marked. The latter is important since the Old Generation is collected separately.
Note: Every application will have a starting point from where objects get instantiated. These objects are called “roots”. Some objects are referenced with these roots directly and some indirectly. GC tracks the live objects from those GC roots.
Phase 2 – Concurrent Marking
During this phase the Garbage Collector traverses the Old Generation and marks all live objects, starting from the roots found in the previous phase of “Initial Mark”. This phase runs concurrently with the application thread. Thus, the application thread will not be stopped.
Phase 3 – Concurrent pre-clean
This is again a concurrent phase running in parallel with the application thread. While marking the live objects in the previous phase, there is a possibility that few of the references would be changed. Whenever that happens, the JVM marks the area of the heap called “Card” that contains the mutated object as “dirty”. This is known as Card Marking.
In the pre-cleaning phase, these dirty objects are accounted for, and the objects reachable from them are also marked. The cards are cleaned when this is done.
Phase 4 – Concurrent Abortable Preclean
This phase again runs in parallel with the application thread. The purpose of this phase is to mark most of the live objects, so that the next phase will not take much time to complete. This phase iterates through the old generation objects to identify the live objects. The duration of this phase depends on a few of the abortion conditions such as the number of iterations, elapsed wall clock time, amount of useful work done etc. When one of the mentioned conditions is met, this phase will be stopped.
Phase 5 – Final remark
This is the second and last stop-the-world phase during the event. The goal of this stop-the-world phase is to finalize marking all live objects in the Old Generation. Since the previous preclean phases were concurrent, they may have been unable to keep up with the application’s mutating speeds. A stop-the-world pause is required to finish the marking.
Usually CMS tries to run final remark phase when Young Generation is as empty as possible in order to eliminate the possibility of several stop-the-world phases happening back-to-back.
Phase 6 – Concurrent Sweep
The purpose of this phase is to sweep off the dead objects in the old generation. As the final marking is done, there is no dependency on the application thread now. Thus, this phase runs concurrently with the application thread.
Phase 7 – Concurrent reset
This phase which runs concurrently with the application thread, resets the inner data structures of the CMS algorithm, preparing them for the next cycle.
ART GC Overview
As described, ART uses CMS as the default GC type. CMS tries to reduce pause time by doing most of the work concurrently to the application thread. The basic GC algorithm remains the same. However, ART further optimizes the algorithm process which uses mostly sticky CMS and partial CMS. In addition to the CMS plan, ART performs heap compaction when the app is moved from background to foreground.
Sticky CMS is ART’s non-moving generational garbage collector. It scans only the portion of the heap that was modified since the last GC and can reclaim only the objects allocated since the last GC. As it frees the memory objects allocated only since the last GC, this is much faster and has less pause time.
Partial CMS means it collects all the spaces except for image spaces and zygote spaces.
ART also introduced a new bitmap-based memory allocator called RosAlloc (Runs of slots allocator). This outperforms DIMAlloc by adding thread-local buffers for small allocation sizes.
Overall, the ART improves the CMS GC plan further to optimize the performance of the system.
Restricted App Memory
The heap size limit for an application varies from device to device. To maintain a functional multi-task environment, Android sets a hard limit on the heap size of the app.If an app tries to allocate more memory when it has reached max heap capacity, then it will throw an OutOfMemoryError. However, one can call getMemoryStatus() to know about the memory status of the app’s heap. Also, if the pause time of the GC process is more, then there is a high chance of “Application Not Responding” error. Either way, it results in a bad user experience.
When a user switches between the apps, Android keeps Apps that are not in the foreground in Least-Recently-Used (LRU) Cache. This means that, when the user switches back to the previous app the state/process will be restored. Thereby, improving the user experience.
As an app process is cached, if it retains memory of the objects which are no longer used then it affects the overall performance of the system. When the system runs low on memory, it starts clearing the processes in LRU starting from the least recently used app. Also, the garbage collector estimates which app is consuming most of the resources and tends to kill the process.
Thus, less memory the app consumes, the more likely it is to remain in the LRU cache which inturn increases user experience.
In addition, we need to avoid memory leaks. A memory leak happens when you hold on to the object long after its purpose has been served. This means that if the object which is no longer needed is not unreferenced, then the garbage collector still thinks it as referenced one, due to which it will never be garbage collected.
Tools to detect memory leaks
As discussed, we need to avoid memory leaks to run applications effectively. There are tools to monitor memory usage and detect memory leaks. A few examples include, Android Profiler and Leak Canary.
Android profiler tool provides real-time data to help understand the CPU, Memory, Network and Battery usage of the app. Android profiler is compatible with Android 5.0 and above.
Leak Canary is a memory leak detection library in Android. This library runs along with the app, dumps memory when needed, looks for potential memory leaks and gives a notification with a clean and useful stack trace to find the root cause of the leak.
Conclusion
Even though garbage collection is quite fast, it still can affect app performance. One cannot control when garbage collection will be triggered. Thus, it is very important for us to know how the GC process works and what should be avoided to improve app performance.
